GeoPoll conducts research for a wide variety of organizations, and with this diverse range comes varying client needs. For this reason, GeoPoll offers multiple, flexible options for data outputs and analyses as we strive to fulfill the unique needs of each of our clients. In this post, we will identify and explain GeoPoll’s most frequently requested data and analysis reports. To learn more about our reporting capabilities, contact us today.
Custom reports on survey results

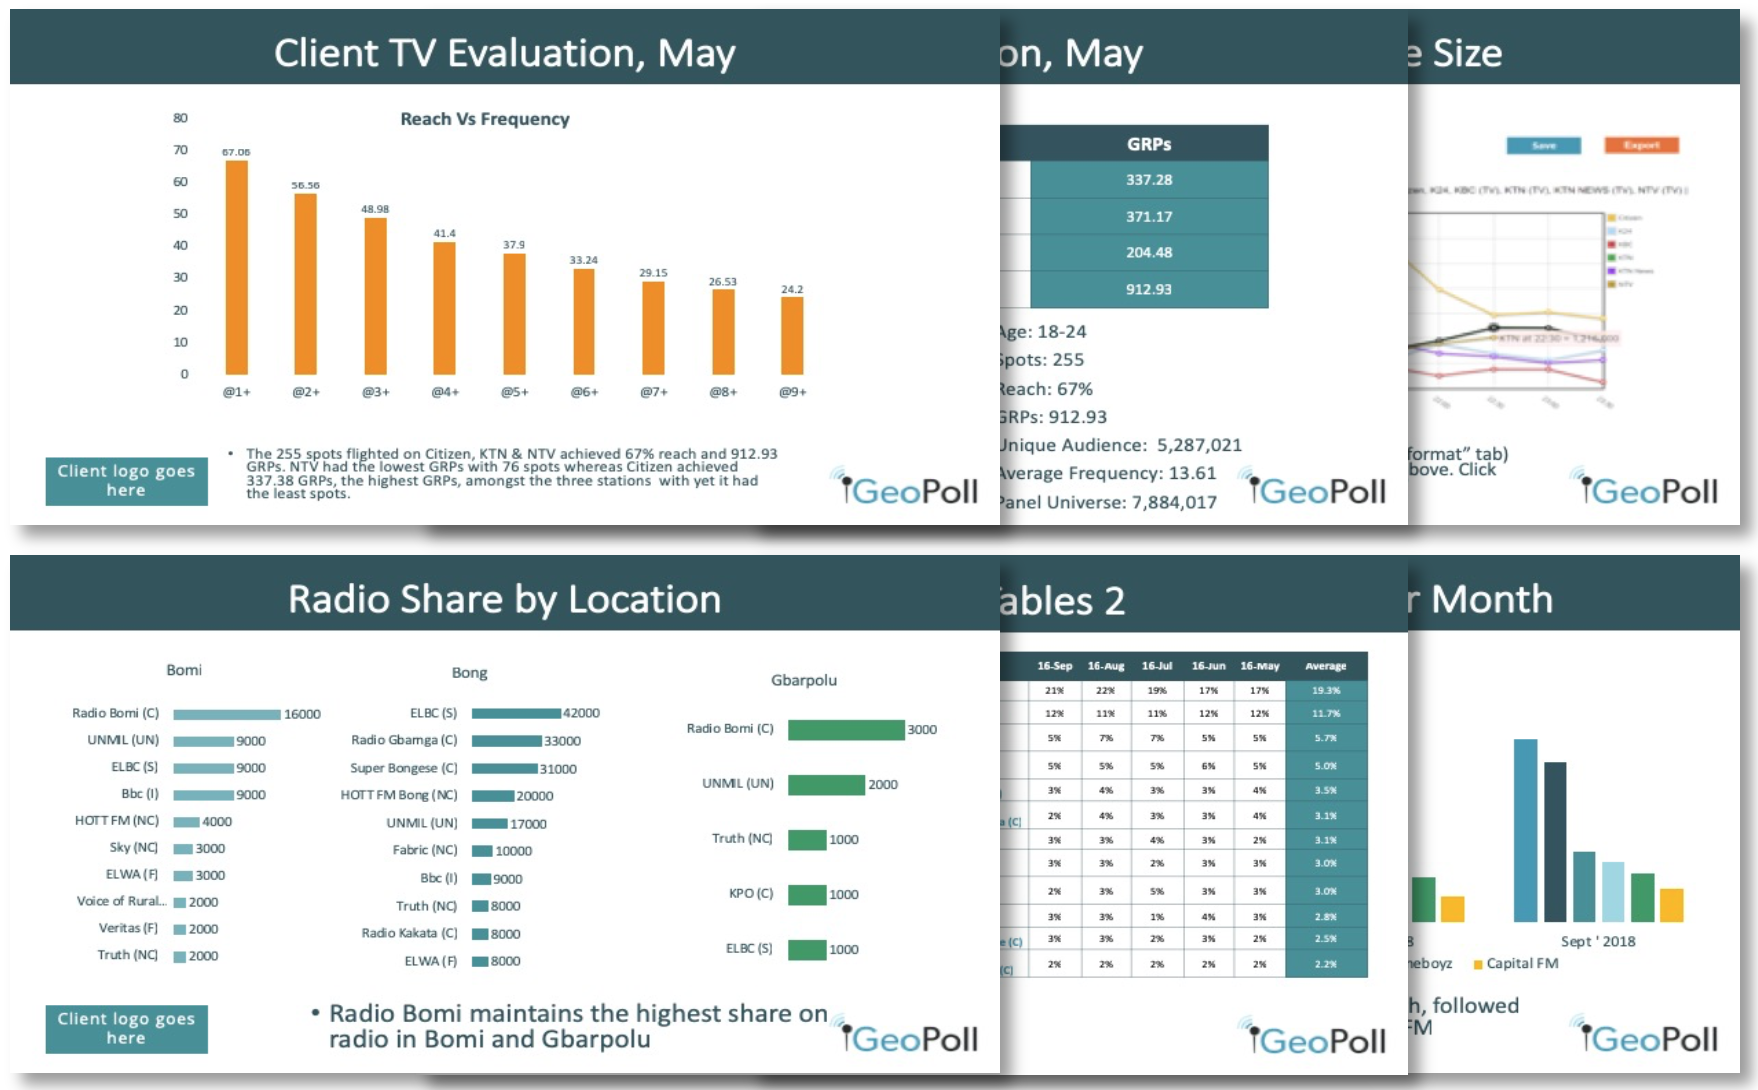
GeoPoll’s custom-built data and analysis reports are one of the most popular options chosen by clients. This reporting option is valuable to our clients because, in these reports, data is cleaned, compiled, organized, and analyzed by GeoPoll’s expert researchers, who have been involved in the project from start to finish. These reports include key insights from the survey data and context for why the findings are pertinent, which saves a significant amount of time for our client’s teams.
The level of detail included in custom reports can vary from short reports with high-level findings to detailed documents which include the sampling specifications and methodological details of a study. Less detail intensive reports are often presented through a custom made and designed PowerPoint slide deck, while reports that require highly detailed analysis are often packaged as PDF documents containing many pages of long-form analysis and data visualizations.
Interactive dashboard for data display
Interactive dashboards are another popular way to analyze and interact with survey data, and are especially well-suited to ongoing projects such as brand health trackers. GeoPoll’s interactive dashboards are highly customizable, so GeoPoll is able to tailor to very specific client requests with ease.
Not only are GeoPoll’s interactive dashboards extremely customizable, they are also exceedingly user friendly. GeoPoll’s dashboards display data visualizations that allow people of any level of data analysis experience to easily view data trends, changes, and patterns. The dashboards provide filter options that allow for comparisons in the data to be made based on demographic qualities. For example, in just a few seconds, a user can toggle from data visualizations representing all respondents from a study to data visualizations representing a study’s female respondents located in Mombasa that are 25-35 years old. The features of GeoPoll’s dashboards save a significant amount of time for both experienced and inexperienced data analysts that are digging through study results for insights.
GeoPoll’s dashboards are available for online access 24/7 and are password protected for secure data keeping.

Custom infographics for promotion of survey results
GeoPoll can create custom designed infographics for any client project. This option is particularly useful for teams that would like to use their survey results for marketing purposes or public display. GeoPoll’s team can work with clients to understand any vision they may have and bring that vision to life through impressive graphic illustrations of the findings. Additionally, we can work with a company’s brand and style guidelines to create an infographic that seamlessly matches other collateral.
Data tables for simplistic reporting needs
Data tables are a popular option for companies analyzing data internally. This data output is packaged in an excel document that contains survey results. The data can be broken down into results by demographic or a mix of demographics, and the document is organized to fit each client’s specifications. Data tables can also include cross-tabulations that examine the relationship between multiple variables, such as income and job type.
Raw data for experienced data scientists
Research organizations that have their own teams of research experts in-house often like to receive their survey data in its purest form so their internal team can organize and analyze the data on their own. For this reason, we offer row level raw data outputs in the form of excel documents or SPSS files.
Other Options
The data outputs presented in this post represent the most common formats that GeoPoll’s clients request, but we are always ready to discuss your organization’s unique needs. To discuss more about our reporting and analysis capabilities, contact us today.


