The coronavirus pandemic has upended the daily lives of people around the world. In this post, we will take a look at how the pandemic has affected the television landscape in Kenya by comparing viewership trends from 2019 with 2020’s trends thus far.
All of the data presented in this report reflect the average viewership numbers for the following time periods: January 1st, 2019 through September 30th, 2019 and January 1st, 2020 through September 30th, 2020.
Average Television Viewership Month Over Month: 2019 vs 2020 Comparison
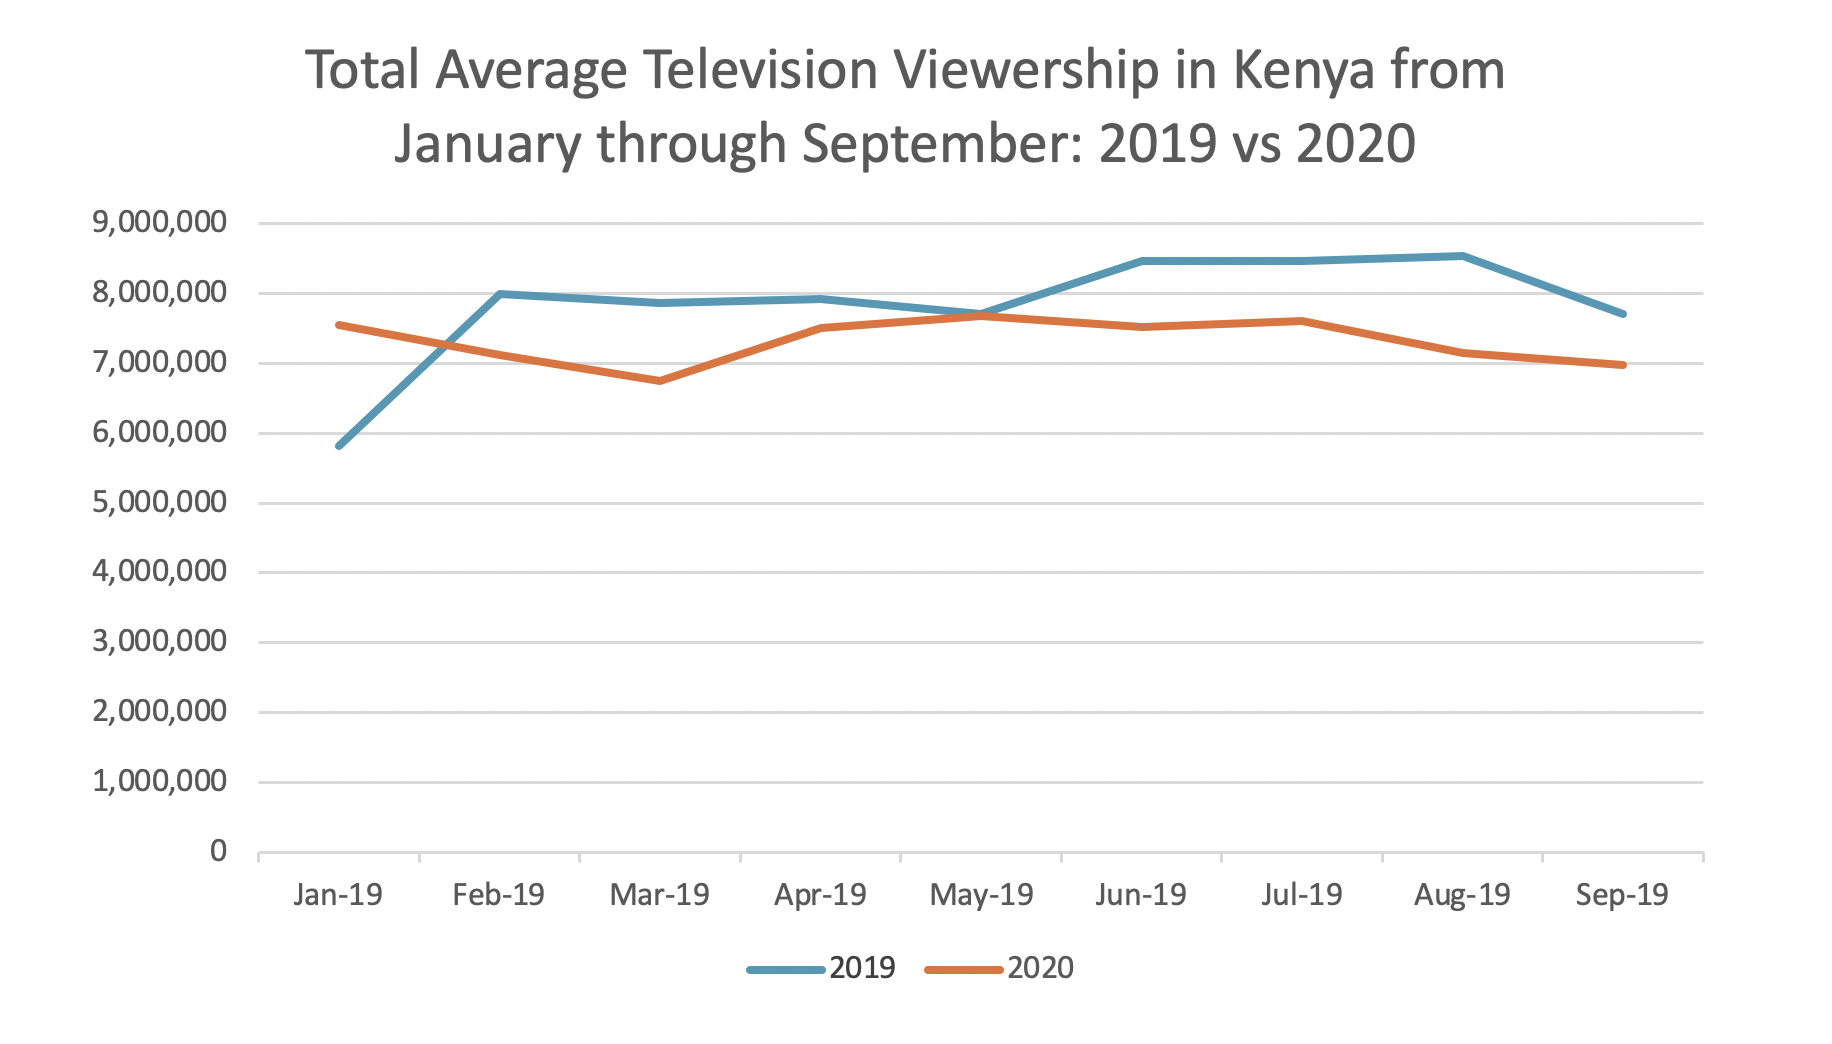
From January to September of 2020, there was an average of 7,318,111 Kenyan television viewers, which was 513,445 viewers less than the average for the same time period in 2019. The chart below shows close-to-opposite trendlines of average viewership month-over-month between the two years. In 2019, Kenyan’s began the year watching the least amount of television of the time period, while the opposite was the case in 2020. January showed the most television viewership of the time period and by March of 2020 viewership declined significantly.
 The year over year comparison between 2019 and 2020 shows just how television viewership was impacted by the coronavirus pandemic. Thus far in 2020, television viewership reached its lowest point in March when the virus safety guidelines were released by the Government of Kenya. As people were staying home more, television viewership rose in April and May; It was at this time the trendlines overlapped, yet in the month’s following, 2020’s viewership dipped as 2019’s viewership rose.
It is likely that many factors contributed to the lower viewership numbers in 2020. However, there are a couple of factors that we feel are worth specifically mentioning in this report. First, we believe that the overall decline in television viewership numbers is in part due to the increased penetration of alternative media platforms—like Video-On-Demand, streaming VOD, YouTube, and creative content on social media platforms—that are direct competition to television viewership. In fact, earlier this year, a GeoPoll study found that the top 3 influencer personalities have been playing their trade mostly on YouTube, Instagram, and Facebook—which emphasizes the impact that internet-based forms of entertainment have had on the media landscape in Kenya.
Another factor that likely has led to a decrease in viewership is the financial strain caused by the pandemic. With so many Kenyan’s unable to work due to social distancing, more people are living hand-to-mouth than before the pandemic. In fact, in a recent GeoPoll study on the financial impact of Coronavirus in 5 sub-Saharan African countries, 49% of respondents reported that their incomes decreased significantly due to the pandemic. In the same study, 71% of respondents reported that they were more concerned with paying expenses now than they were before the pandemic, and Kenyan respondents were covering expenses with loans and credit more than any other source. The findings from this financial impact study, combined with the trends seen in television viewership throughout 2020, lead us to believe that Kenyan’s had tighter budgets and television viewership was limited in-part due to electricity and cable costs.
Kenya’s Top Television Stations year over year: 2020 vs. 2019

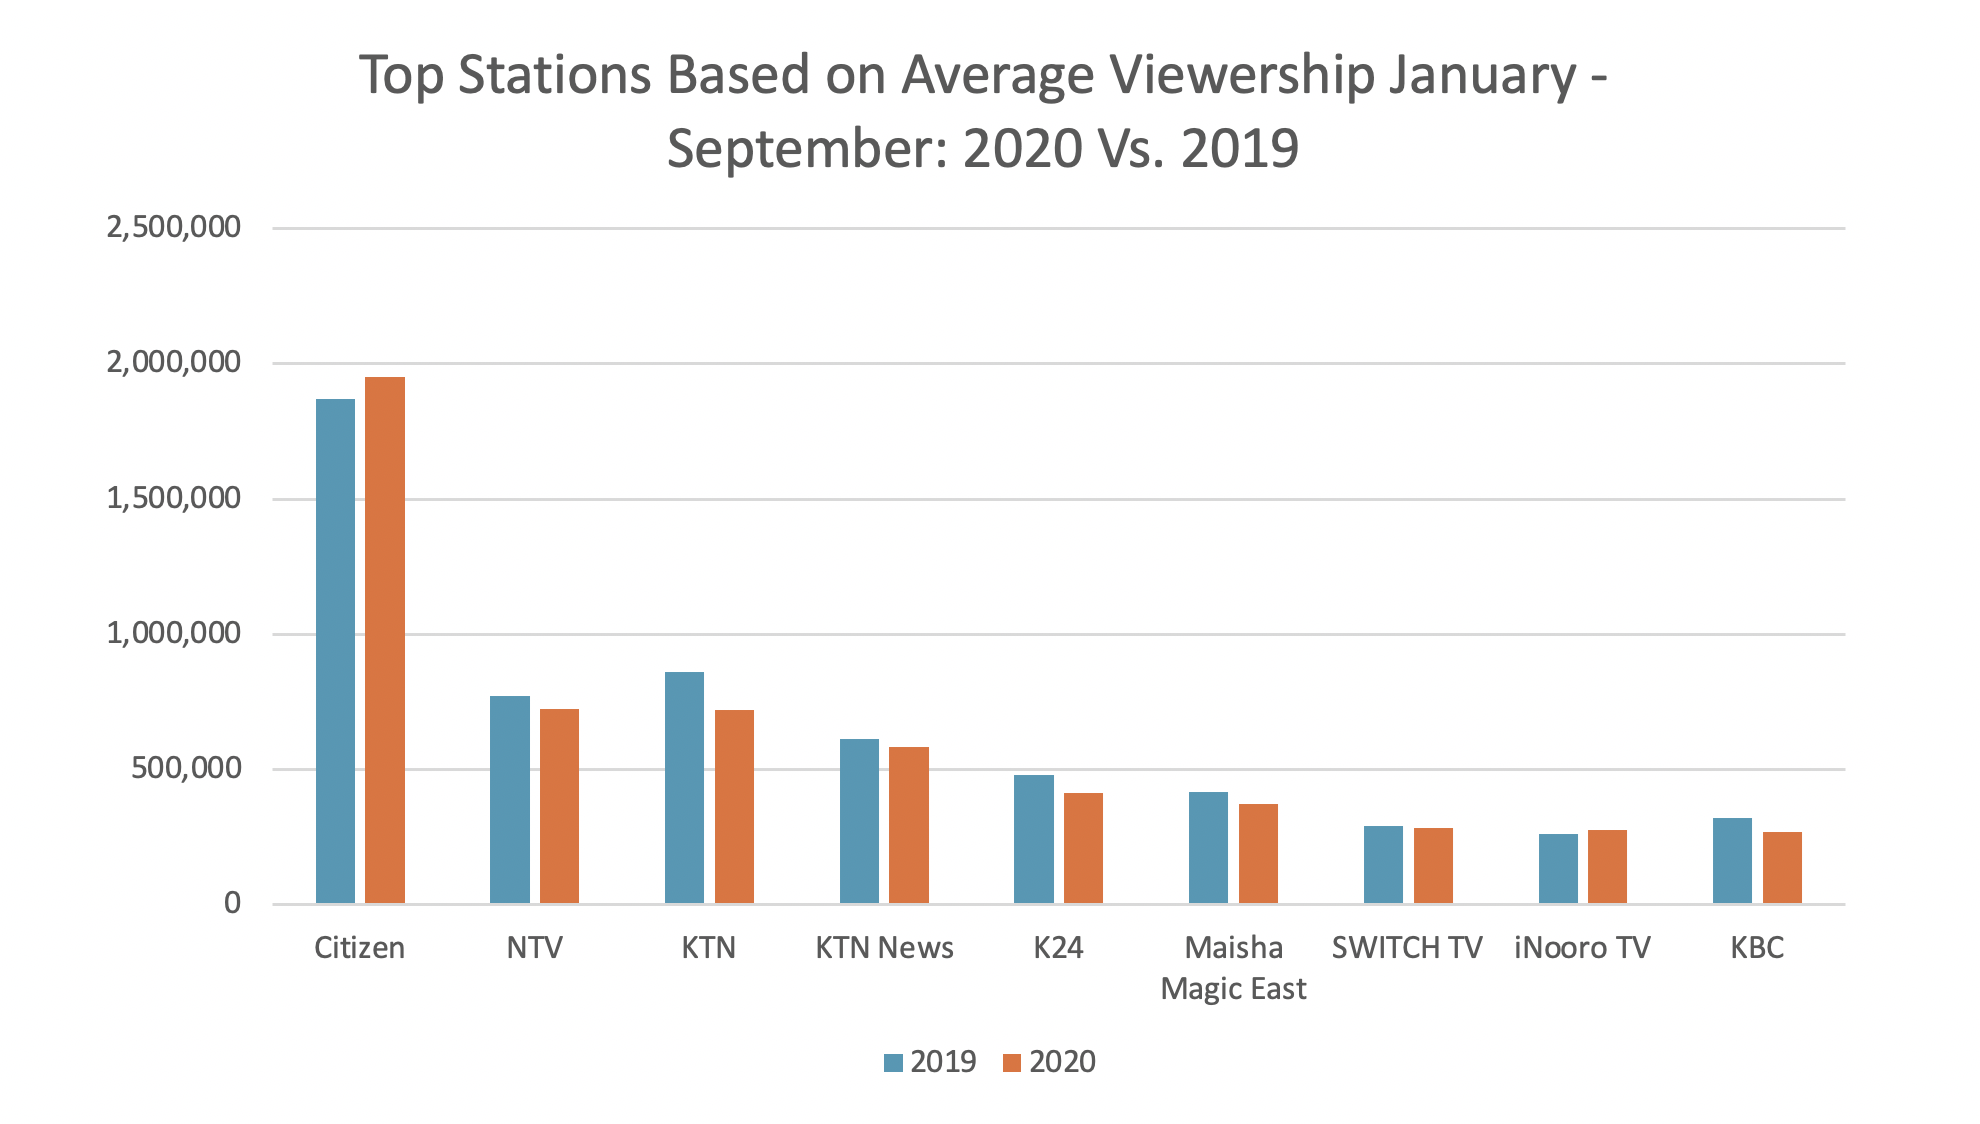
When we take a look at the viewership levels of the top stations on average during the time period, we can see that Citizen TV’s viewership increased from 2019 to 2020, even though there was a decline in television viewership overall in 2020. This finding shows that Citizen TV was even more popular in 2020 than it was in 2019.
A few factors may have led to an increase in viewership for Citizen. First, our 2020 data presented in this report was predominantly from months effected by the COVID-19 pandemic. During the pandemic, news content was consumed more often than average because people were seeking the latest updates on the pandemic. Additionally, children were at home, rather than school and day-care, during the lockdown period. Due to children being home constantly, parents have been seeking out more educational, yet entertaining, television content for their children. We believe that these two reasons are the primary drivers behind the high viewership of Citizen, as well as the viewership of stations that kept their viewership similar to last year’s viewership, despite average television viewership numbers lowering overall in 2020 compared to 2019.
Average Viewership Month Over Month By Age: 2019 vs 2020

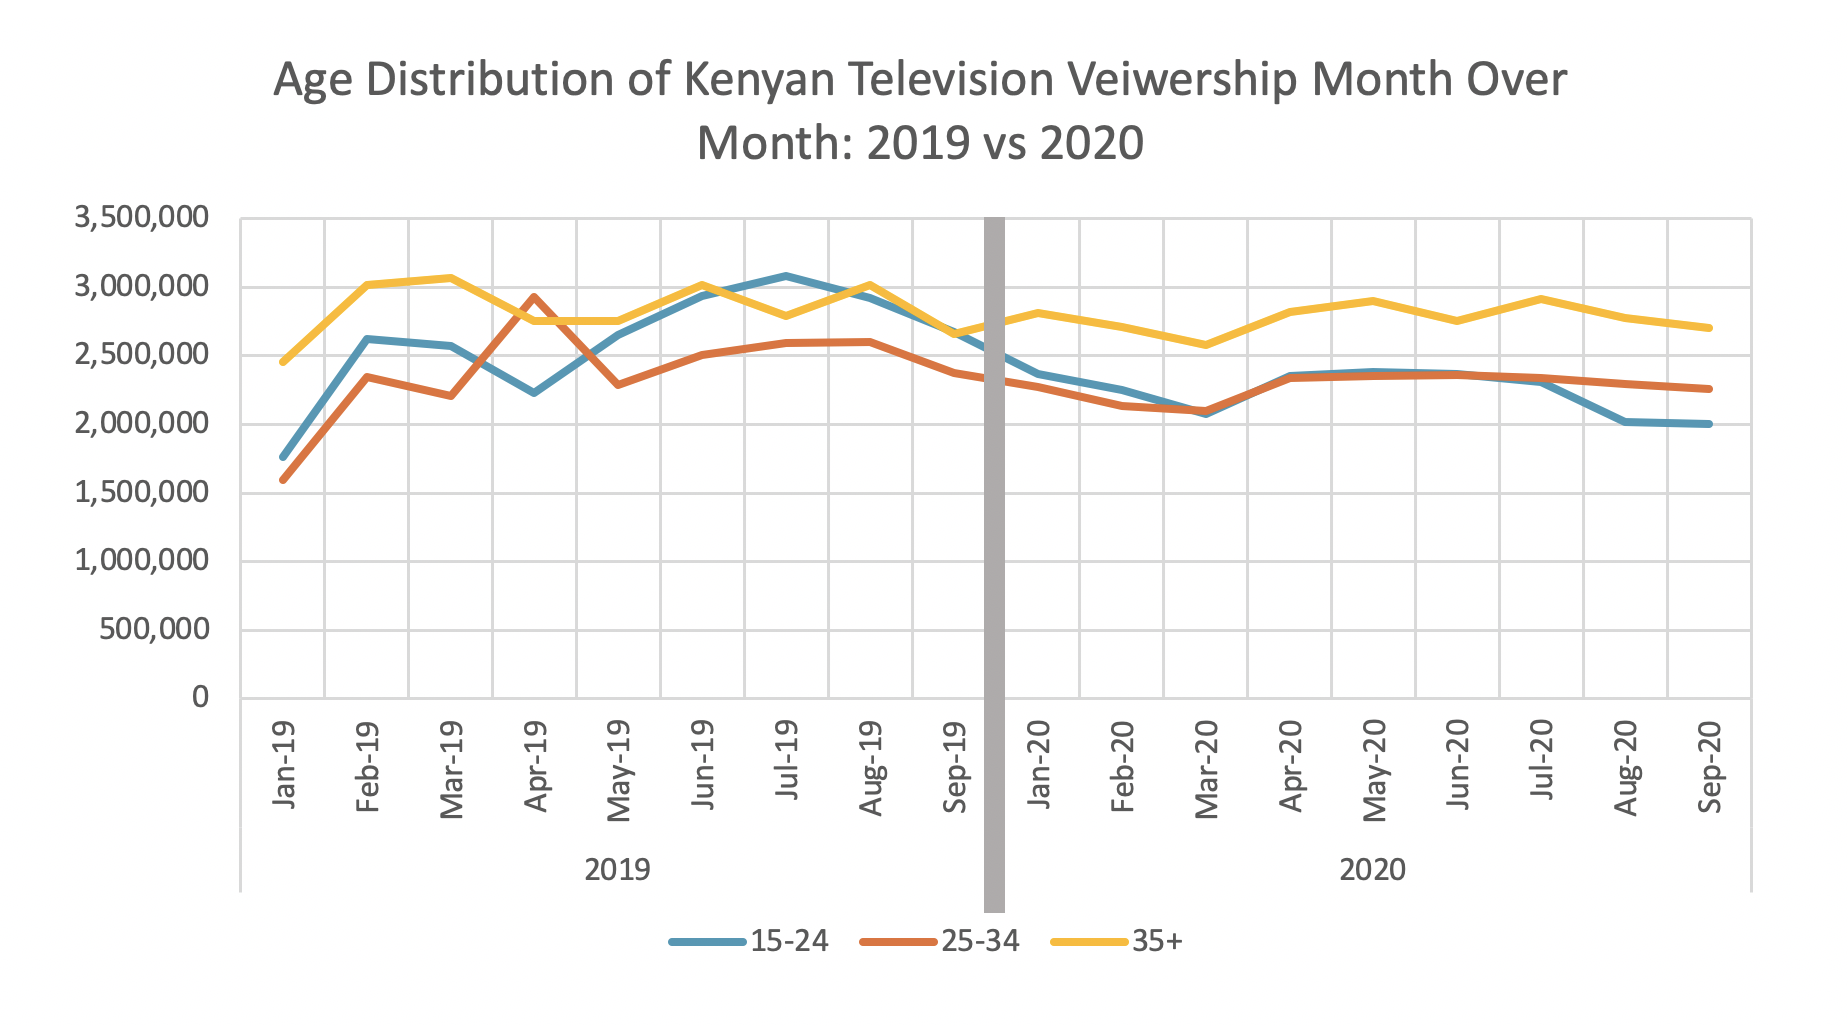
The chart above displays how each of the age groups engaged with television content each month from January through September and shows the changes in trends over time from 2019 through 2020. The data displayed shows some stark differences in viewership patterns by age group. In 2019, viewership by age group changed pretty significantly each month, yet in 2020 the viewership by age group stayed much steadier.
When analyzing each age group’s trends individually, the 35+ age group showed the least variation month over month and when 2019 trends are compared to 2020 trends. The 35+ age group’s average viewership numbers stayed mostly in the 2.5 million to 3 million viewers per month range, and more often than not, the 35+ age group had more viewership than the other age groups in both 2019 and 2020.
The younger two age groups, 15-24 and 25-34, had significantly more variation month to month in 2019 than was seen in 2020. In 2019, the 15-24 age group had a range of 1.3 million between the lowest and highest viewership months, and the 25-34 age group had a range of 1.4 million. In 2020, both age groups only had a range of approximately 300,000 between the lowest and highest viewership months. These changes in viewership trends were most likely caused primarily due to changes in daily life, priorities, work schedules, income, etc. that have emerged to do the coronavirus pandemic.
GeoPoll’s Audience Measurement Services
GeoPoll’s proprietary Audience Measurement platform collects data from thousands of respondents, multiple times a day, on media consumption. The data is available in one-off reports, recurring reports, or an all-access monthly subscription. To learn more about how GeoPoll’s Audience Measurement data and tools can help inform your next campaign, contact us today.


