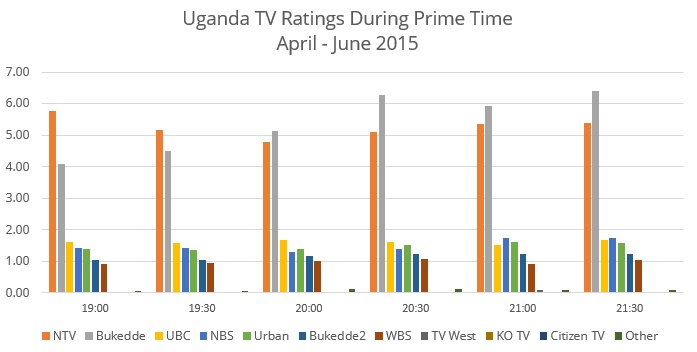
Using the daily data collected through GeoPoll’s Media Measurement Service, GeoPoll has analyzed the top TV stations in Uganda for Q2 of 2015, April 1st – June 30th. We examined both TV ratings* and share** for the top stations in Uganda. The below chart shows the average TV ratings in Uganda for the top 10 stations during prime time from 19:00 to 21:30.

As displayed in the above chart, NTV shows high ratings from 19:00 to 19:30, when they air the news show ‘Akawungeezi’. Bukedde TV picks up from 20:00 and has the highest ratings during prime time at 20:30 when a popular soap ‘It might be you’ airs.
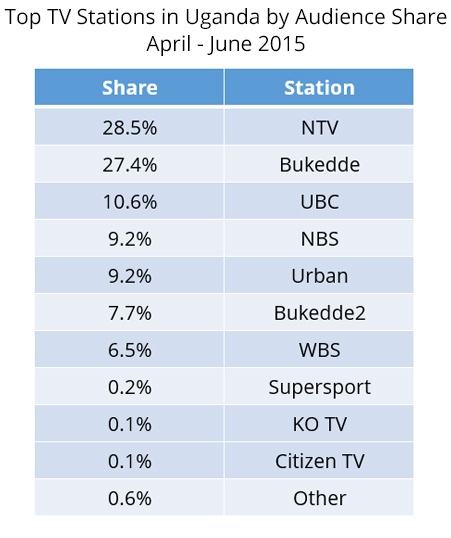
GeoPoll also examined average share over the entire period from April 1st – June 30th. GeoPoll found that NTV had the highest share in Q2 capturing on average 28.5% of the audience. Bukedde was close behind, with a share of 27.4%, and UBC comes in third with a lower share of 10.6%. Full results are below:

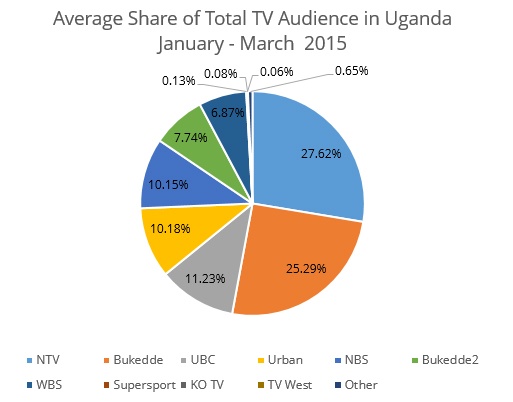
For comparison, below is the share we observed for Q1. UBC, NBS and Urban TV experienced a decrease in share from Q1 to Q2. NTV and Bukedde experienced a slight increase in their share.

On June 15, the Uganda Communications Commission (UCC) started a phased switch-off of analogue television, starting with Kampala and areas within a radius of 60 kilometres. We expect to see a change in ratings and share in Q3, which we will again share on the GeoPoll blog.
*Rating is the proportion watching a station out of the total sample at that time, multiplied by 100. If 50 people out of 500 surveyed watched Station X, the rating for Station X would be (50/500)*100) = 10. In Uganda, GeoPoll’s Media Measurement Panel includes a sample of over 500 respondents for every time period.
**Share is the proportion watching Station X, out of all those watching at that time. This is equal to the proportion watching a station during a given time divided by the total number watching at that time.


